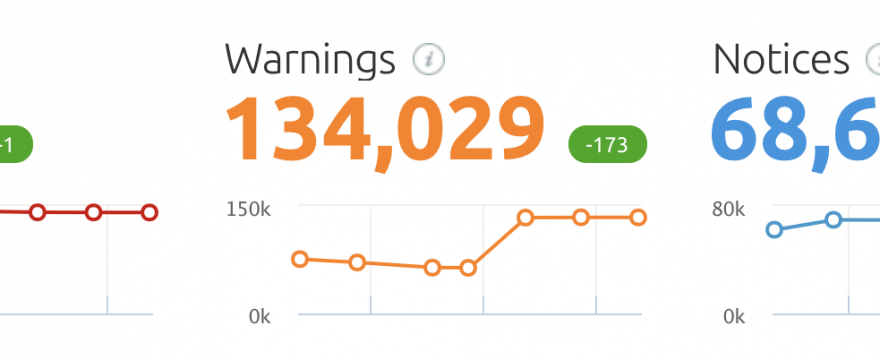
Automatic crawl report tools generally give a dump of data. The better ones will seek to prioritize critical issues over items worth further investigation but generally you end up with a dashboard of totals like:

If you don’t see a lot of these reports, or haven’t had the experience of getting these errors or warnings down to 0 for exactly no traffic improvement, you might think your site was about to explode.
If you go from blissfully ignorant to seeing thousands of “Errors” and “Warnings,” on your main site, you will be instantly discouraged.
And we don’t want that.
Luckily, these tools generally overrepresent (one page template problem will be counted once for each page its found on), misrepresented (actually, a few thousand redirects isn’t a lot), and even noise.
What matters comes down to context and returns on effort.
Very often, you can fix or improve a handful of actual items, and watch your number of issues drop in these report tools by the thousands. And it’s not just inflated numbers dropping, when you fix issues that exist in a template used on thousands of pages, a series of small positive effects can be significant.
If you can only fix 1 thing a week, seeing 1k pages with “Links lead to HTTP pages for HTTPS site,” is noise. But if you can have a VA run through a list, chat your host with a request to force SSL, it becomes a might as well item.
Aside: If you use SEMRush, I created a video on how to export a mega CSV from one tool (Projects > Site Audit) and then use conditional formatting in Google Sheets to visualize issues by page.
