This is a follow-up post comparing search versus social for traffic to a site.
Repasting for context: In a recent email Bob Lalasz of Science+Story shared common objection to doing SEO he often hears from clients:
“Search is over — everybody I care about is on Twitter and I can reach them that way.”
A lot of industries and organizations see a high number of people using Twitter.
To name a few: politics/news, sports, local businesses, academia/research, tech/developers, marketing/branding, design/creative.
Mark Schaefer, the guy that wrote the book on Twitter has a great pro-using Twitter for amplifying content post that is worth a read. He posits that engagement is crazy high for 1:1 interactions and puts it on brands, that they are simply failing at their goals on Twitter.
It’s good context for me as I’ve gone through this exercise of really trying to reconsider Twitter as a good tool for content amplification.
Marketers are generally down on Twitter for content
He comments on a common attitude among marketers: even though we (marketers) also spend a lot of time on Twitter, we view it as a low value channel for dissemination of client content.
I’m not sure where this attitude among marketers came from and after reading Mark’s 2017 post linked above, I wanted to investigate further.
In trying to suss things out, there is a fair amount of evidence for Twitter decline.
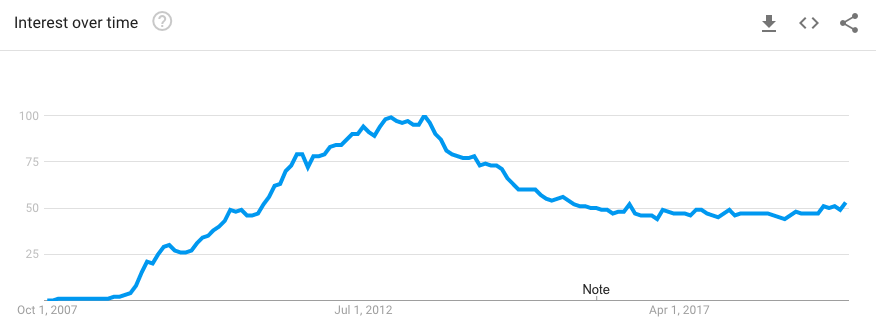
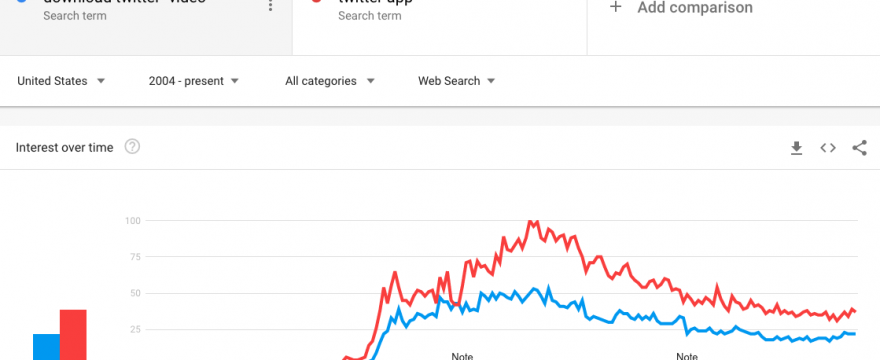
The above line chart shows Google searches on the phrase “Twitter” over the past 12 years, with a peak in 2012 or so.
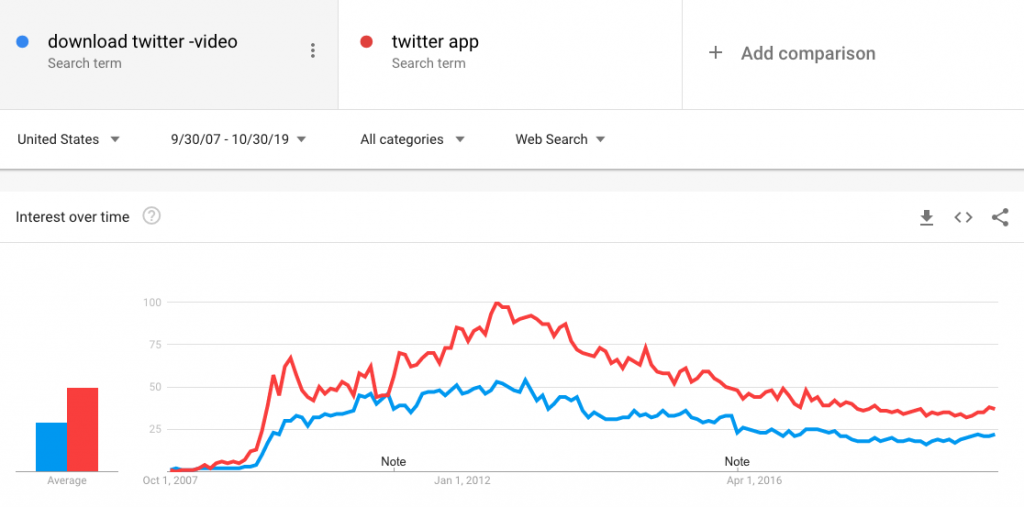
I thought this data might be flawed, that we were just looking at Twitter app adoption, which would remove the need for searching Google to get to Twitter, but alas:
Also, it seems like every few months, a study comes out comparing social channels and Twitter get’s found wanting.
A recent one by Rival IQ comparing engagement from 1,800 companies with active presences on Twitter, Facebook, and Instagram across the top 12 industries, shows Twitter far behind:
This holds for non-profits and higher ed, though those two industries see relatively high engagement across social channels compared to other industries.
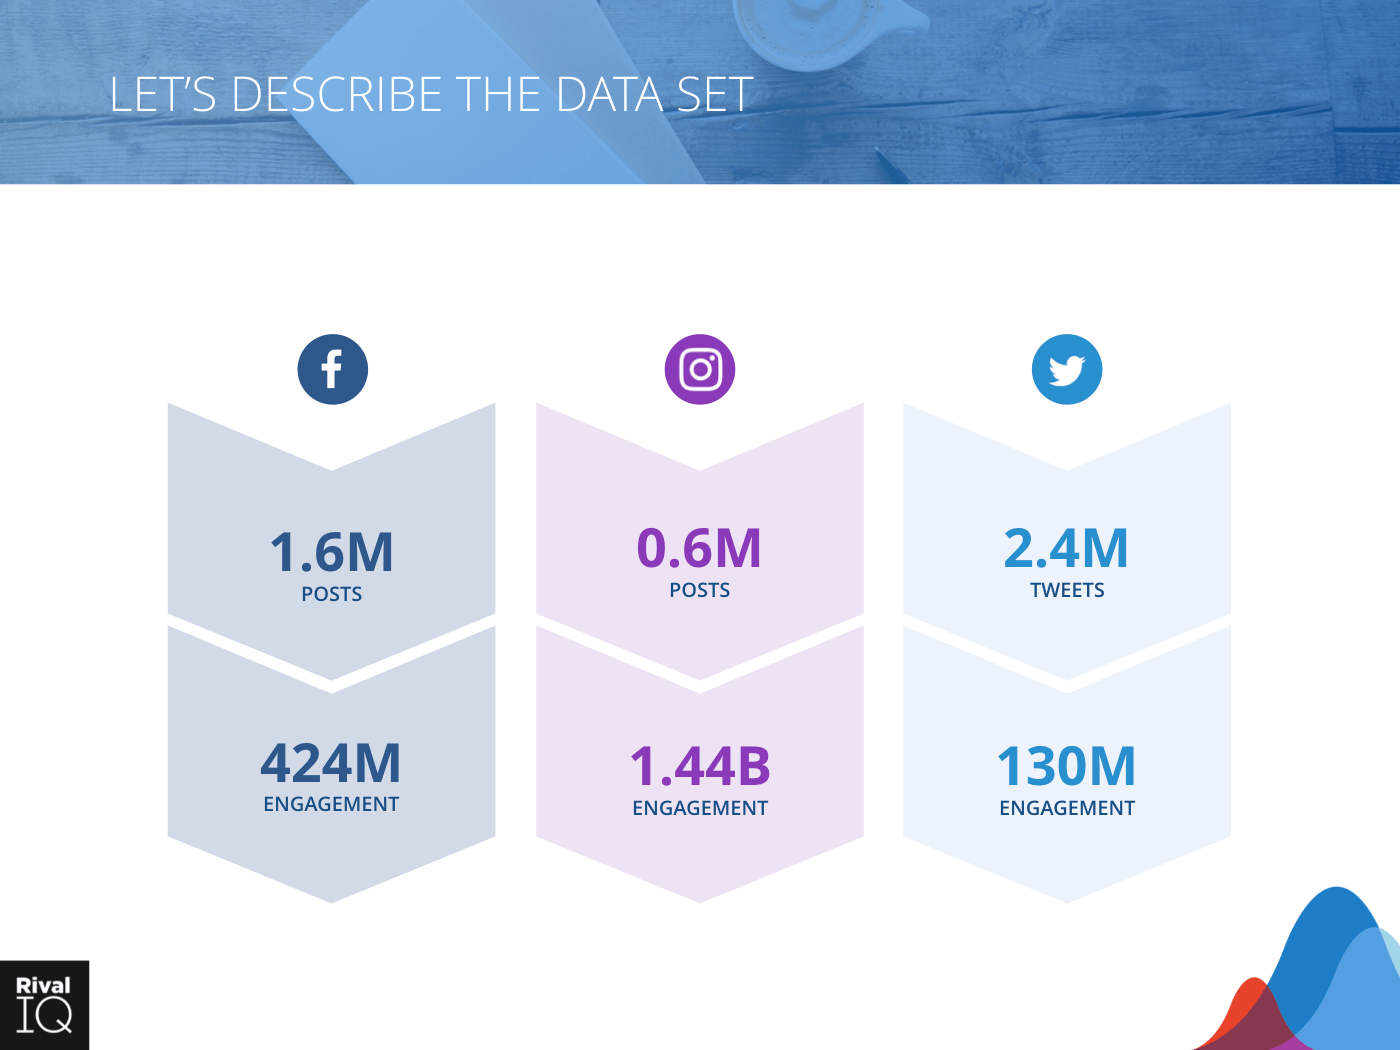
They compare the channels on a bunch of factors related to engagement rate, but per post/tweet:
- Facebook 0.09% median across industries with range of 0.04% to 0.14%, alcohol, higher ed, hotels, sports, and nonprofits at the upper end
- Instagram 1.6% median engagement rate with range of 0.84% to 2.4% with higher ed breakout of almost 4%.
- Twitter median engagement rate of 0.048% with range of 0.009% to 0.08%. Alcohol and higher ed at the higher end, with media industry the lowest by far
To be fair, “engagement” is tricky.
I once had to cobble together social data from linkedin, twitter, instagram, pinterest, and facebook into a Google Data Studio dashboard, and I can tell you trying to compare metrics from different channels is like trying to compare cars and trucks – it is not at all apples to apples.
Twitter impressions and Facebook reach are a world apart in how they are calculated. Facebook has like 30 types of engagement and probably includes things like mouse cursors hovering over a video as the user scrolls.
On the plus side for Twitter, daily active users is up, Twitter says.
As recently reported by WaPo:
126 million daily active users, a figure that is dwarfed by Facebook’s 1.2 billion daily users and that falls short of Snapchat’s daily users by 60 million… the number of [Twitter} daily users continues to grow, with a 9 percent increase in daily active users compared with the same period last year.
Jeff Bezos’ WaPo
Assumptions about what engagement is
So status quo thinking on Twitter for engagement is that it’s low compared to alternatives. Status quo thinking on “engagement” is that it’s a vanity metric with no measurable business value.
Business value estimates can only be generated in aggregate, conversions happen in an ecosystem of multiple channels, and data is all around messy.
That said, tweets on average receive less than 0.1% engagement.
To boot, more than half of shares on content happen without the sharer even reading the linked article, contributing further to the vanity of content “reach” metrics on Twitter.
A total hunch based on recent work learning about communities and network science, engagement on content happens predominantly by those in your existing circle or those closely tied with your existing social group.
And engagement follows power curves and PageRank patterns of clusters forming around the already most influential nodes (people/accounts).
Aside: Of course, Google follows the same patterns as it was built on PageRank.
There’s all these phenomena that predict how social networks develop with a lot of accuracy, like “preferential attachment,” the idea that the next likely connections between two nodes will be “distributed among a number of individuals or objects according to how much they already have” (Wikipedia).
The same people share and engage with your content over and over.
This is fine if you’ve “arrived” and your only goal is to connect with your existing audience. But that’s rarely what we’re looking for when we commit a lot of energy to a channel like this.
But take your existing impact measures on Twitter and control for these considerations:
- more than half don’t read what they share
- it’s mostly your existing audience that consistently engages with your content
- trim the mean for outlier tweets with runaway engagement as they inflate your typical returns and are hard to reproduce
At that point, you’re left with very little of actual substance.
See for yourself.
How to check your own Twitter engagement data
If you’d like to see a breakdown of a Twitter profile’s influence, this is a new neat tool by the same person. You can check your own, and then benchmark it against people who have achieved a measure of visibility that you would like to reach. That will help you determine whether the road you’re on will lead you to where you’d like to go.
You can also just log into Twitter and check analytics.twitter.com for typical engagement on your tweets.
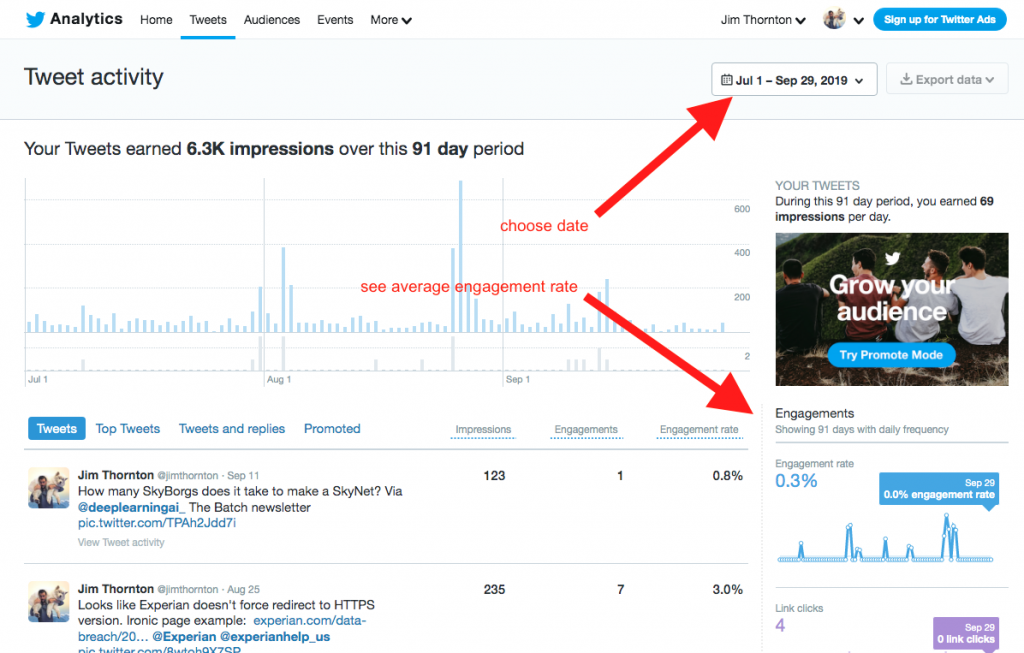
Twitter hides your “engagement rate,” probably because it’s sadly low, so once logged into your analytics dashboard you need to click “View all tweet activity.”
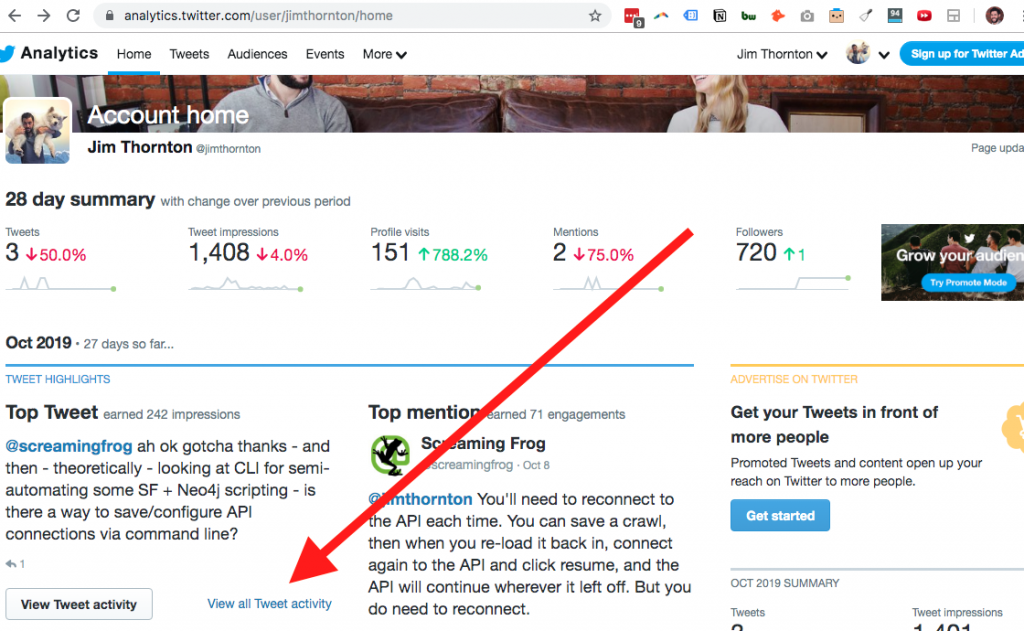
My engagement rate for the first three quarters of 2019 (and I don’t user Twitter very much) is 0.4%, 0.3%, and 0.4% respectively. Twitter Analytics will only let you see quarterly or less:
Anecdotal twitter engagement level reports
I understand this is completely anecdotal, but it’s not much better for others in my field. If you expand that tweet link for replies, you’ll see a lot of active Twitter users sharing their engagement metrics. Clicking through myself, it’s a lot of people around 0.9% to 1.4% and another 20% or so of people sharing around 2-3%.
Final thoughts
Twitter is great for interaction.
For outreach, it’s been about as good to me as email. And it’s pretty wild that I can interact with , organizations I admire and those I look up to like people in my field and authors of books I like.
Assumptions are dangerous
But my friends aren’t on Twitter. They’re on Facebook and Instagram. So it’s easy for me to think “everyone’s on Facebook.” But that’s an assumption. Couple it with the assumption that I can “reach” them even if they are there and we’re just stacking assumptions.
We can check our assumptions by looking at our analytics, paying attention to ROI, and comparing channels.
You may put a lot of energy into Twitter and no energy into Google but still see 10x more traffic from Google.
If you’ve had a different experience, I’d love to hear about it.
Articles referencing this one